Another strong quarter of growth, sales guidance raised.
Third Quarter 2022 Nine Months 2022
(unaudited) USG Turnover TO vs 2021 USG Turnover TO vs 2021
Unilever 10.6% €15.8bn 17.8% 8.9% €45.6bn 16.1%
Beauty & Wellbeing 6.7% €3.3bn 24.4% 7.8% €9.0bn 21.9%
Personal Care 8.9% €3.6bn 20.0% 7.5% €10.1bn 16.4%
Home Care 13.6% €3.2bn 22.0% 11.6% €9.3bn 18.5%
Nutrition 11.8% €3.3bn 4.8% 8.2% €10.5bn 9.4%
Ice Cream 13.2% €2.4bn 20.8% 10.1% €6.7bn 15.7%
Third Quarter highlights
• Underlying sales growth accelerated to 10.6% in the quarter, and sales guidance raised for the full year
• Price growth stepped up to 12.5% in the quarter, with volumes declining 1.6%
• Turnover increased 17.8% including a currency impact of 8.8% and (2.1)% from disposals net of acquisitions
• The billion+ Euro brands, accounting for more than 50% of Group turnover, grew 14%, led by strong
performances from OMO, Hellmann’s, Rexona, Magnum and Lux
• Simpler, more category-focused organisation operating since 1 July
• Continued portfolio reshaping with the sale of the global tea business completed and the acquisition of
Nutrafol, a leading provider of hair wellness products
• Second €750 million share buyback tranche, announced in September, will complete in December 2022
• Quarterly interim dividend for Q3 2022 is maintained at €0.4268
Chief Executive Officer statement
“Unilever has delivered another quarter of growth in challenging macroeconomic conditions. Underlying sales
growth improved to 10.6%, led by further increases in pricing with only a limited impact on volume, and we now
expect underlying sales growth for the full year 2022 to be above 8%.
We have delivered growth in each of our five Business Groups, led by a strong performance from our billion+ Euro
brands, growing 14% in the quarter. Strong pricing allows us to continue to drive increased investment behind our
brands.
Our organisation is now better structured to deliver consistent growth through a simpler, more category-focused
operating model. The full benefits will be realised over time, and we are seeing encouraging early signs of improved
accountability and faster decision-making.
The global macroeconomic outlook remains mixed, and we expect the challenges of high inflation to persist in 2023.
The delivery of consistent growth remains our first priority.”
Alan Jope
27 October 2022
OUTLOOK
We now expect underlying sales growth for the full year 2022 to be above 8%, with more negative underlying volume
growth than in the first nine months.
Our expectation for net material inflation (NMI) for 2022 is virtually unchanged at around €4.5 billion, with €2.5
billion in the second half. Although some commodities have softened from their peaks, we expect cost pressure to
carry forward into 2023, driven by currency devaluation, higher raw material costs versus beneficial covers in the first
half of 2022, and higher supplier processing costs from energy and labour inflation. Our current estimate for NMI in
H1 2023 versus H1 2022 is in the region of €2 billion, with a range of possible outcomes.
Investment in growth is our priority, and we will continue to protect investment levels. In the second half of 2022, we
expect to increase spend in brand and marketing, R&D and capital expenditure, as we did in the first half. Our full
year underlying operating margin expectation for 2022 remains at 16%, and we continue to expect to improve
margin in 2023 and 2024, through pricing, mix and savings.
(unaudited) Turnover USG UVG UPG Acquisitions Disposals Currency Turnover
change
Third Quarter €15.8bn 10.6% (1.6)% 12.5% 1.0% (3.1)% 8.8% 17.8%
Nine Months €45.6bn 8.9% (1.6)% 10.7% 0.8% (1.1)% 6.9% 16.1%
Performance
Underlying sales growth stepped up to 10.6% and was broad-based across all Business Groups. Price growth has
sequentially improved in each of the past seven quarters, reaching 12.5% in the third quarter. While pricing had, as
expected, some negative impact on volume, underlying volume growth improved in four Business Groups compared
to the second quarter.
Beauty & Wellbeing grew 6.7%, driven by price with slightly negative volume primarily due to core Skin Care and Hair
Care. Personal Care underlying sales were up 8.9%, led by increased pricing and a lower volume decline as
Deodorants returned to volume growth. Home Care delivered 13.6% USG with a volume decline of 3.6%, having taken
the highest pricing action given its exposure to input cost increases. Nutrition grew 11.8% with virtually flat volume
due to strong performances in Dressings and Food Solutions. Ice Cream improved underlying sales by 13.2%, driven
by double-digit price growth in both in-home and out-of-home. Volume was up 1.0%, helped by a strong summer
season in Europe compared to the prior year.
Emerging markets grew 13.3% with a 14.9% contribution from price and volume at (1.4)%. South Asia continued to
grow strongly through both price and volume. Price growth in Latin America increased to 23.2% with volumes
contracting by 4.6%. China returned to slightly positive growth, and sales growth in South-East Asia benefitted from
lapping the prior year lockdown effect in some markets. Developed markets increased by 7.1%, with 9.3% from price
and (2.0)% from volume. North America grew 8.3%, boosted by strong performances of Nutrition and Ice Cream.
Europe delivered 5.4% growth, helped by double-digit growth in Ice Cream.
Turnover increased 17.8% to €15.8 billion, which included a currency impact of 8.8% and (2.1)% from disposals net of
acquisitions. This reflects the sale of the global tea business, ekaterra, which completed on 1 July 2022.
Capital allocation and operating model
On 22 July, we completed the first tranche of €750 million of the share buyback programme of up to €3 billion. On 6
September 2022, we announced a second tranche of €750 million which will complete in December 2022. The
quarterly interim dividend for the third quarter is maintained at €0.4268.
Our pension funds faced no liquidity or operational issues through recent market volatility and remain well funded.
Since 1 July 2022, our simpler, more category-focused operating model for Unilever has been in place, organised
around five Business Groups and a technology-driven backbone, Unilever Business Operations. We expect to deliver
the new structure within existing restructuring plans, and to generate around €600 million of cost savings over the
first two years after 1 July, with the majority in 2023.
Following the release of this trading statement on 27 October 2022 at 7:00 AM (UK time), there will be a live webcast
at 8:00 AM available on the website www.unilever.com/investor-relations/results-and-presentations/latest-results. A
replay of the webcast and the slides of the presentation will be made available after the live meeting.
As this is the first trading statement reflecting the new structure, we have provided historical information since 2019
for the five Business Groups at www.unilever.com/investors/results-presentations/other-reporting-announcements.
Underlying sales growth (USG), underlying volume growth (UVG) and underlying price growth (UPG) are non-GAAP measures (see page 9)
We now expect underlying sales growth for the full year 2022 to be above 8%, with more negative underlying volume
growth than in the first nine months.
Our expectation for net material inflation (NMI) for 2022 is virtually unchanged at around €4.5 billion, with €2.5
billion in the second half. Although some commodities have softened from their peaks, we expect cost pressure to
carry forward into 2023, driven by currency devaluation, higher raw material costs versus beneficial covers in the first
half of 2022, and higher supplier processing costs from energy and labour inflation. Our current estimate for NMI in
H1 2023 versus H1 2022 is in the region of €2 billion, with a range of possible outcomes.
Investment in growth is our priority, and we will continue to protect investment levels. In the second half of 2022, we
expect to increase spend in brand and marketing, R&D and capital expenditure, as we did in the first half. Our full
year underlying operating margin expectation for 2022 remains at 16%, and we continue to expect to improve
margin in 2023 and 2024, through pricing, mix and savings.
(unaudited) Turnover USG UVG UPG Acquisitions Disposals Currency Turnover
change
Third Quarter €15.8bn 10.6% (1.6)% 12.5% 1.0% (3.1)% 8.8% 17.8%
Nine Months €45.6bn 8.9% (1.6)% 10.7% 0.8% (1.1)% 6.9% 16.1%
Performance
Underlying sales growth stepped up to 10.6% and was broad-based across all Business Groups. Price growth has
sequentially improved in each of the past seven quarters, reaching 12.5% in the third quarter. While pricing had, as
expected, some negative impact on volume, underlying volume growth improved in four Business Groups compared
to the second quarter.
Beauty & Wellbeing grew 6.7%, driven by price with slightly negative volume primarily due to core Skin Care and Hair
Care. Personal Care underlying sales were up 8.9%, led by increased pricing and a lower volume decline as
Deodorants returned to volume growth. Home Care delivered 13.6% USG with a volume decline of 3.6%, having taken
the highest pricing action given its exposure to input cost increases. Nutrition grew 11.8% with virtually flat volume
due to strong performances in Dressings and Food Solutions. Ice Cream improved underlying sales by 13.2%, driven
by double-digit price growth in both in-home and out-of-home. Volume was up 1.0%, helped by a strong summer
season in Europe compared to the prior year.
Emerging markets grew 13.3% with a 14.9% contribution from price and volume at (1.4)%. South Asia continued to
grow strongly through both price and volume. Price growth in Latin America increased to 23.2% with volumes
contracting by 4.6%. China returned to slightly positive growth, and sales growth in South-East Asia benefitted from
lapping the prior year lockdown effect in some markets. Developed markets increased by 7.1%, with 9.3% from price
and (2.0)% from volume. North America grew 8.3%, boosted by strong performances of Nutrition and Ice Cream.
Europe delivered 5.4% growth, helped by double-digit growth in Ice Cream.
Turnover increased 17.8% to €15.8 billion, which included a currency impact of 8.8% and (2.1)% from disposals net of
acquisitions. This reflects the sale of the global tea business, ekaterra, which completed on 1 July 2022.
Capital allocation and operating model
On 22 July, we completed the first tranche of €750 million of the share buyback programme of up to €3 billion. On 6
September 2022, we announced a second tranche of €750 million which will complete in December 2022. The
quarterly interim dividend for the third quarter is maintained at €0.4268.
Our pension funds faced no liquidity or operational issues through recent market volatility and remain well funded.
Since 1 July 2022, our simpler, more category-focused operating model for Unilever has been in place, organised
around five Business Groups and a technology-driven backbone, Unilever Business Operations. We expect to deliver
the new structure within existing restructuring plans, and to generate around €600 million of cost savings over the
first two years after 1 July, with the majority in 2023.
Following the release of this trading statement on 27 October 2022 at 7:00 AM (UK time), there will be a live webcast
at 8:00 AM available on the website www.unilever.com/investor-relations/results-and-presentations/latest-results. A
replay of the webcast and the slides of the presentation will be made available after the live meeting.
As this is the first trading statement reflecting the new structure, we have provided historical information since 2019
for the five Business Groups at www.unilever.com/investors/results-presentations/other-reporting-announcements.
Outlook
Third Quarter Review: Unilever Group
Conference Call and historical information
3
Underlying sales growth (USG), underlying volume growth (UVG) and underlying price growth (UPG) are non-GAAP measures (see page 9)
Third Quarter 2022 Nine Months 2022
(unaudited) Turnover USG UVG UPG Turnover USG UVG UPG
Unilever €15.8bn 10.6% (1.6)% 12.5% €45.6bn 8.9% (1.6)% 10.7%
Beauty & Wellbeing €3.3bn 6.7% (0.6)% 7.3% €9.0bn 7.8% 0.6% 7.2%
Personal Care €3.6bn 8.9% (4.1)% 13.5% €10.1bn 7.5% (3.8)% 11.8%
Home Care €3.2bn 13.6% (3.6)% 17.8% €9.3bn 11.6% (3.4)% 15.6%
Nutrition €3.3bn 11.8% 0.1% 11.7% €10.5bn 8.2% (1.4)% 9.7%
Ice Cream €2.4bn 13.2% 1.0% 12.0% €6.7bn 10.1% 1.0% 9.0%
see & read more on
https://www.unilever.com/files/ab36a5b7-ee73-4845-bd6a-65068a988bea/ir-q3-2022-full-announcement.pdf
tijd 10.39
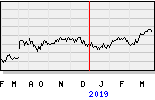
Unilever EUR 44,54 -7,5 ct vol. 431.569