ey points Q4 2017
Further improvement compared to Q3 2017
Topline stabilised
Gross profit up 7%
Growth in The Netherlands at 16%
All time high headcount in Europe
Key points FY 2017
Revenue down by 11% at EUR 790 million
EBIT of EUR 18 million
Cash at EUR 126 million
Proposed dividend EUR 0.15 per share
Brunel International (unaudited)
P&L amounts in EUR million
Q4 2017 Q4 2016 Change FY 2017 FY 2016 Change%
Revenue 210.2 210.6 0% a 790.1 884.9 -11% b
Gross Profit 49.4 46.2 7% 182.7 187.1 -2%
Gross margin 23.5% 21.9% 23.1% 21.1%
Operating costs 43.0 44.1 -2% c 164.8 160.3 3% d
EBIT 6.4 2.1 221% 17.9 26.8 -33%
EBIT % 3.0% 1.0% 2.3% 3.0%
Average directs 10,505 9,078 16% 9,589 9,315 3%
Average indirects 1,533 1,435 7% 1,497 1,481 1%
Ratio direct / Indirect 6.9 6.3 6.4 6.3
a -1 % like-for-like
b -11 % like-for-like
c -2 % like-for-like
d 3 % like-for-like
Like-for-like is measured excluding the impact of currencies and acquisitions
Q4 2017 results
Revenue
In Q4, for the first time in three years, we have been able to match prior year's revenue, despite fewer working days in Europe. This is a strong confirmation of the recovery we have seen accelerating throughout this year. The Netherlands was the biggest driver, but also our other segments contributed.
Gross Profit
The gross margin improved by 1.6ppt to 23.5%, as a result of the change in business mix with higher margins in Europe compared to Global Business, but also as a result of higher margins in Global Business.
Operating Costs
Operating costs decreased compared to last year. Adjusted for one off items, both in Q4 2017 and Q4 2016, operating cost increased by 5% due to continued investments in new initiatives, sales force and technology.
EBIT
As a result of further growth EBIT increased by 200% to EUR 6 million, even despite fewer working days in Europe.
Q4 2017 results by division
Brunel Global Business (unaudited)
P&L amounts in EUR million
Q4 2017 Q4 2016 Change% FY 2017 FY 2016 Change%
Revenue 92.1 100.4 -8% a 338.0 447.1 -24% b
Gross Profit 13.0 11.4 14% 41.2 49.2 -16%
Gross margin 14.1% 11.4% 12.2% 11.0%
Operating costs 13.3 14.7 -10% c 46.7 50.8 -8% d
EBIT -0.3 -3.3 91% -5.5 -1.6 -239%
EBIT % -0.3% -3.3% -1.6% -0.4%
Average directs 5,406 4,292 26% 4,728 4,596 3%
Average indirects 551 516 7% 520 571 -9%
Ratio direct / Indirect 9.8 8.3 9.1 8.0
a -10 % like-for-like
b -26 % like-for-like
c -8 % like-for-like
d -8 % like-for-like
Like-for-like is measured excluding the impact of currencies and acquisitions
Revenue
YoY revenue decreased by 8% (10% LFL), but increased compared to Q3. All regions, except South East Asia, achieved growth from Q3 to Q4, with Middle East and Australasia being the strongest drivers. The growth is the result if all the diversification initiatives, helped by the first signs of recovery in our Oil & Gas market. As expected, the contribution of our new shutdown and maintenance activities in the USA was still limited in Q4, but the pipeline of projects remains promising.
Gross Profit
The gross margin continued to increase as a result of the diversification, a change in the (geographical) mix, increased perm fees and the year end reconciliation of employee related liabilities. However, the margin pressure in our traditional Oil & Gas market remains.
Operating Costs
Operating cost increased, also adjusted for the impact of the acquisition of SES, mainly due to investments in sales staff for our new investments and an additional EUR 1 million of one off items (bad debt, severance and employee claims).
EBIT
The growth resulted in an almost break even EBIT for Q4. SES already contributed to EBIT in Q4.
Brunel Europe (unaudited)
P&L amounts in EUR million
Q4 2017 Q4 2016 Change% FY 2017 FY 2016 Change%
Revenue 118.2 110.1 7% 452.1 437.8 3%
Gross Profit 36.4 33.9 7% 141.5 137.9 3%
Gross margin 30.8% 30.8% 31.3% 31.5%
Operating costs 27.6 25.8 7% 108.3 100.1 8%
EBIT 8.8 8.1 8% 33.2 37.8 -12%
EBIT % 7.4% 7.4% 7.3% 8.6%
Average directs 5,099 4,785 7% 4,861 4,719 3%
Average indirects 929 874 6% 925 868 7%
Ratio direct / Indirect 5.5 5.5 5.3 5.4
Brunel Europe consists of Brunel Germany, Brunel Netherlands, Brunel Belgium, Brunel Czech Republic, Brunel Switzerland and Brunel Austria
Brunel Germany (unaudited)
P&L amounts in EUR million
Q4 2017 Q4 2016 Change% FY 2017 FY 2016 Change%
Revenue 54.7 53.6 2% 219.5 210.5 4%
Gross Profit 17.6 18.9 -6% 75.9 75.2 1%
Gross margin 32.2% 35.2% 34.6% 35.7%
Operating costs 14.0 13.4 4% 53.9 50.5 7%
EBIT 3.6 5.5 -34% 22.0 24.7 -11%
EBIT % 6.6% 10.2% 10.0% 11.7%
Average directs 2,384 2,272 5% 2,311 2,209 5%
Average indirects 422 377 12% 418 402 4%
Ratio direct / Indirect 5.6 6.0 5.5 5.5
Revenue
Germany's revenue has increased compared to the same period last year, despite two less working days in Q4. Revenue per working day increased by 4.6%.
FY 2017 revenue development is also impacted by three less working days compared to 2016. Revenue per working day increased by 4.4% in 2017.
The gross margin adjusted for working days for Q4 is 34.2% (2016: 35.2%). For FY 2017 the gross margin adjusted for working days is 35.3% (2016: 35.7%).
Operating Costs
During the fourth quarter operating costs have increased compared to 2016. This is mainly a result of increased staff costs.
EBIT
EBIT for the quarter decreased by 34% to EUR 3.6 million, mainly due to the impact of the working days and increased overhead expenses. The EBIT adjusted for working days in the quarter is 9.4%, for FY 2017 the EBIT adjusted for working days is 11.0%.
Working days Germany
Q1 Q2 Q3 Q4 FY
2018 63 60 65 62 250
2017 65 59 65 60 249
2016 62 62 66 62 252
Brunel Netherlands (unaudited)
P&L amounts in EUR million
Q4 2017 Q4 2016 Change% FY 2017 FY 2016 Change%
Revenue 53.9 46.3 16% 195.3 191.4 2%
Gross Profit 16.7 13.1 28% 57.3 54.5 5%
Gross margin 31.0% 28.3% 29.3% 28.5%
Operating costs 11.4 10.4 10% 46.0 41.6 11%
EBIT 5.3 2.7 97% 11.3 12.9 -12%
EBIT % 9.8% 5.8% 5.8% 6.8%
Average directs 2,368 2,184 8% 2,220 2,178 2%
Average indirects 430 423 2% 435 395 10%
Ratio direct / Indirect 5.5 5.2 5.1 5.5
Revenue
Revenue in The Netherlands increased by 16% compared to the fourth quarter of 2017, mainly driven by the business lines Engineering and IT. Revenue per working day increased by 17.7%. As a result of the strong performance in Q4, the FY 2017 revenue exceeds last year's revenue by 2%.
Gross Profit
The gross margin adjusted for working days is 31.8% (2016: 28.3%). The increase in gross margin is the combined effect of an increase in average rates and a higher productivity.
Operating cost
Operating cost increased due to further investments in our sales force, further development of recruitment and matching technologies and the start of our data analytics activities in Pretty Good Knowledge.
EBIT
The leverage resulting from the strong growth at higher margins in Q4 more than offset the increased operating cost, resulting in a strong increase in EBIT, even despite one less working day.
Working days The Netherlands
Q1 Q2 Q3 Q4 FY
2018 64 61 65 64 254
2017 65 61 65 63 254
2016 63 62 66 64 255
Effective tax rate
In 2017 the effective tax rate decreased from 56.2% to 44.7%, but was still impacted significantly by impairment of deferred tax assets of EUR 1.5 million. Due to the lower EBIT level, this impairment has a significant impact (10%) on our effective tax rate for 2017.
Cash position
The December 2017 cash balance amounted to EUR 126 million and decreased by EUR 23 million YoY.
Dividend
We propose a dividend of EUR 0.15 per share.
Outlook
Both in The Netherlands and in Germany we ended 2017 at a higher headcount than previous year. The resulting higher starting headcount for 2018, in combination with further growth will also result in growth in revenue and improved profitability.
For Global Business we expect to return to year on year growth from Q1 onwards, mainly driven by all our new initiatives, but possibly with some tailwind from a recovery in the Oil & Gas market. But more importantly, Global Business will also return to profitability in 2018.
Jilko Andringa, CEO of Brunel International N.V.: "I'm very pleased that just after I've joined Brunel I'm able to present for the first time in three years quarterly results of Brunel without a decline in revenue, and a strong improvement in EBIT. In my first three months I have visited many Brunel offices across the globe. I enjoyed all the open and inspiring interactions with colleagues and clients, learned a lot about the many exiting projects that we have in the pipeline, and those new ones we are managing already. So this is just the start of another period of strong growth for Brunel. For now, I want to thank all Brunellers and our clients, and of course especially Jan Arie van Barneveld, for the turning point that was reached in 2017 and for all the hard work that has been put into this. "
tijd 09.05
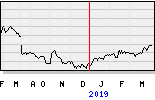
De Smallcap 1.089,42 +0,20 +0,02% Brunel EUR 15,81 -34ct vol. 16.000