Luxembourg, July 29, 2020 (07:00 CET) - Aperam (referred to as “Aperam” or the “Company”) (Amsterdam, Luxembourg, Paris,
Brussels: APAM, NYRS: APEMY), announced today results for the three months ending June 30, 2020.
Highlights
- Health and Safety: LTI frequency rate of 0.6x in Q2 2020 compared to 1.9x in Q1 2020
- Steel shipments of 376 thousand tonnes in Q2 2020, 14% decrease compared to steel shipments of 438 thousand
tonnes in Q1 2020
- EBITDA of EUR 49 million in Q2 2020, compared to EUR 70 million in Q1 2020
- Net income of EUR 21 million in Q2 2020, compared to EUR 29 million in Q1 2020
- Basic earnings per share of EUR 0.27 in Q2 2020, compared to EUR 0.36 in Q1 2020
- Cash flow from operations amounted to EUR 57 million in Q2 2020, compared to EUR 63 million in Q1 2020
- Free cash flow before dividend of EUR 34 million in Q2 2020, compared to EUR 18 million in Q1 2020
- Net financial debt of EUR 123 million as of June 30, 2020, compared to EUR 108 million as of March 31, 2020
Strategic initiatives
- Leadership Journey ® 2 Phase 3 : The annualized gains reached EUR 21 million in Q2 2020. Aperam realized cumulative
annualized gains of EUR 171 million at the end of Q2 2020, compared to the target of EUR 200 million by the end of 2020
Prospects
- EBITDA in Q3 2020 is expected to remain at a comparable level versus Q2 2020
- Net financial debt is expected to reach its seasonal peak in Q3 2020
Timoteo Di Maulo, CEO of Aperam, commented:
“I’m proud to report that we have kept our workforce on our sites safe throughout the COVID crisis in the second quarter,
thanks to our strict protocols and the full collaboration of our people. Our flexible and resilient business model enabled us to
cope well with the sudden demand drop. Strict cost management across all divisions, stable contribution from Alloys and a
good performance in Brazil allowed us to remain profitable and cash generative. Although demand has started to recover, we
expect it to remain clearly below the historical normal level. Unrevised safeguard quotas that continue to support excessive
imports pose another strong headwind. We therefore expect the coming quarter to remain as challenging as this one was. ”
Financial Highlights (on the basis of financial information prepared under IFRS)
(in millions of Euros, unless otherwise stated) Q2 20 Q1 20 Q2 19 H1 20 H1 19
Sales 818 1,049 1,090 1,867 2,268
Operating income 14 34 59 48 105
Net income attributable to equity holders of the parent 21 29 57 50 82
Basic earnings per share (EUR) 0.27 0.36 0.69 0.63 0.99
Diluted earnings per share (EUR) 0.27 0.36 0.69 0.63 0.99
Free cash flow before dividend and share buy-back 34 18 72 52 96
Net Financial Debt (at the end of the period) 123 108 176 123 176
EBITDA 49 70 95 119 176
EBITDA/tonne (EUR) 130 160 204 146 182
Steel shipments (000t) 376 438 465 814 966
Health & Safety results
Health and Safety performance based on Aperam personnel figures and contractors’ lost time injury frequency rate was 0.6x in
the second quarter of 2020 compared to 1.9x in the first quarter of 2020.
Financial results analysis for the three-month period ending June 30, 2020
Sales for the second quarter of 2020 decreased by 22% to EUR 818 million compared to EUR 1,049 million for the first quarter of
2020. Steel shipments decreased from 438 thousand tonnes in the first quarter of 2020, to 376 thousand tonnes in the second
quarter of 2020.
EBITDA decreased during the quarter to EUR 49 million from EUR 70 million for the first quarter of 2020. Volumes in both
Europe and Brazil were substantially impacted by the COVID induced demand drop. Prices remained under pressure. Lower raw
material prices caused negative inventory valuation effects. The gains from the Leadership Journey® were not sufficient to offset
these negative factors.
Depreciation and amortization was EUR (35) million for the second quarter of 2020.
Aperam had an operating income for the second quarter of 2020 of EUR 14 million compared to an operating income of EUR 34
million for the previous quarter.
Financing costs including the FX and derivatives result for the second quarter of 2020 were positive at EUR 9 million, including
cash cost of financing of EUR (2) million and exceptional interest income of EUR 15 million in Brazil for PIS/Cofins tax credits
related to prior periods.
Income tax expense for the second quarter of 2020 was EUR (2) million.
The Company recorded a net income of EUR 21 million for the second quarter of 2020.
Cash flows from operations for the second quarter of 2020 were positive at EUR 57 million, with a working capital increase of
EUR 37 million. CAPEX for the second quarter was EUR (23) million.
Free cash flow before dividend for the second quarter of 2020 amounted to EUR 34 million.
During the second quarter of 2020, the cash returns to shareholders amounted to EUR 37 million, consisting fully of dividend.
Operating segment results analysis
Stainless & Electrical Steel (1)
(in millions of Euros, unless otherwise stated) Q2 20 Q1 20 Q2 19 H1 20 H1 19
Sales 632 827 842 1,459 1,773
EBITDA 43 53 79 96 131
Depreciation, amortisation & impairment (28) (30) (30) (58) (60)
Operating income 15 23 49 38 71
Steel shipments (000t) 364 426 440 790 919
Average steel selling price (EUR/t) 1,678 1,876 1,856 1,785 1,864
(1) Amounts are shown prior to intra-group eliminations
The Stainless & Electrical Steel segment had sales of EUR 632 million for the second quarter of 2020. This represents a 24%
decrease compared to sales of EUR 827 million for the first quarter of 2020. Steel shipments during the second quarter were 364
thousand tonnes, a decrease of 15% compared to shipments of 426 thousand tonnes during the previous quarter. The COVID
induced demand drop caused volumes in Europe to decline substantially despite lower import pressure. The COVID crisis also negatively impacted volumes in Brazil in a seasonally stronger quarter. Average steel selling prices for the Stainless & Electrical
Steel segment decreased by 11% compared to the previous quarter.
The segment generated EBITDA of EUR 43 million for the second quarter of 2020 compared to EUR 53 million for the first quarter of 2020. The negative volume impact was not fully compensated by a less negative inventory valuation effect from raw material
pricing and Leadership Journey® gains.
Depreciation and amortisation expense was EUR (28) million for the second quarter of 2020.
The Stainless & Electrical Steel segment had an operating income of EUR 15 million for the second quarter of 2020 compared to
an operating income of EUR 23 million for the first quarter of 2020.
Services &Solutions (1)
(in millions of Euros, unless otherwise stated) Q2 20 Q1 20 Q2 19 H1 20 H1 19
Sales 310 450 453 760 973
EBITDA 5 9 16 14 32
Depreciation & amortisation (4) (3) (4) (7) (6)
Operating income 1 6 12 7 26
Steel shipments (000t) 132 186 182 318 396
Average steel selling price (EUR/t) 2,212 2,331 2,374 2,281 2,341
(1) Amounts are shown prior to intra-group eliminations
The Services & Solutions segment had sales of EUR 310 million for the second quarter of 2020, representing a decrease of 31%
compared to sales of EUR 450 million for the first quarter of 2020. For the second quarter of 2020, steel shipments were 132 thousand tonnes compared to 186 thousand tonnes during the previous quarter. The Services & Solutions segment had lower
average steel selling prices during the period compared to the previous period.
The segment generated EBITDA of EUR 5 million for the second quarter of 2020 compared to EBITDA of EUR 9 million in the first
quarter of 2020. EBITDA decreased mainly due to a significant 29% drop in volumes quarter on quarter that was not
compensated by a less negative inventory valuation effect and Leadership Journey® gains.
Depreciation and amortisation was EUR (4) million for the second quarter of 2020.
The Services & Solutions segment had an operating income of EUR 1 million for the second quarter of 2020 compared to an
operating income of EUR 6 million for the first quarter of 2020.
Alloys & Specialties (1)
see & read more on
https://www.aperam.com/sites/default/files/documents/Q2_2020_ER_Press%20Release_EN.pdf
tijd 10.49
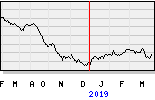
De Midcap 771,43 -3,69 -0,48% Aperam EUR 25,56 +76ct vol. 54.000