• Execution of strategy fully on track - strongly positioned for multiple opportunities ahead
• Vacancy rate of 13.8% (down 4.6% versus year-end 2017)
• EPRA NAV of € 39.75 per share (up 8% versus year-end 2017)
• EPRA EPS of € 2.64 per share (including € 0.12 in net negative one-off effects)
• A healthy balance sheet with an LTV of 36.9%
• Stable dividend of € 2.16 per share, with final dividend proposed at € 1.12 per share.
NSI KEY FIGURES
Key financial metrics1Revenues and earnings (€ ‘000)
2018 2017 Change (%) Gross rental income 83,721 89,000 -5.9%2 Net rental income 69,228 74,468 -7.0%2
Direct investment result 48,745 49,365 -1.3% Indirect investment result 42,780 42,237 1.3% Total investment result 91,525 91,602 -0.1%
Earnings per share 4.95 5.05 -1.9% EPRA earnings per share 2.64 2.72 -3.1% Dividend per share3 2.16 2.16 0.0% EPRA cost ratio A (incl. direct vacancy costs) 26.5% 26.5% 0.0 pp EPRA cost ratio B (excl. direct vacancy costs) 25.0% 24.3% 0.7 pp
Balance sheet (€ ‘000)
31 December 2018 31 December 2017 Change (%)
Investment property 1,202,691 1,072,180 12.2% Assets held for sale 3,940 28,791 -86.3% Net debt -447,909 -408,453 9.7% Equity 733,283 672,688 9.0%
IFRS equity per share 39.48 36.63 7.8% EPRA NAV per share 39.75 36.66 8.4% EPRA NNNAV per share 39.20 36.13 8.5%
Net LTV 36.9% 36.9% 0.0 pp
Number of ordinary shares outstanding 18,574,298 18,364,998 1.1% Weighted average number of ordinary shares outstanding 18,473,101 18,133,178 1.9%
zie & lees verder op
https://nsi.nl/wp-content/uploads/2019/01/Preliminary-results-FY-2018-FINAL.pdf
tijd 09.32
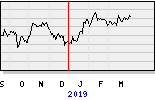
NSI EUR 37,00 +25ct vol. 4.822