Schiphol, the Netherlands - 27 October 2016. GrandVision N.V. publishes the Nine Months and Third Quarter 2016 trading update.
Highlights
9M16 revenue grew by 6.1% at constant exchange rates (3Q16: 4.9%) to €2,495 million (3Q16: €825 million) with reported revenue growth of 3.2% (3Q16: 2.2%)
Comparable growth in 9M16 was 1.7%; 0.4% in 3Q16 was driven by weakness in the Other Europe segment, particularly in Finland and Italy
Adjusted EBITDA (i.e. EBITDA before non-recurring items) grew by 4.3% at constant exchange rates (3Q16: 0.2% ) to €411 million in 9M16 with reported adj. EBITDA growth of 2.8% (3Q16: -1.9%)
The adjusted EBITDA margin remained constant at 16.5% (3Q16: 16.8%)
GrandVision remains confident in achieving its medium term objectives of delivering annual revenue growth of at least 5% and high single digit adjusted EBITDA growth at constant exchange rates
Total number of stores grew to 6,454 (6,110 at year-end 2015) as a result of store openings and acquisitions, especially in the Americas & Asia segment
Key figures
in millions of EUR (unless stated otherwise) 9M16 9M15
Change versus prior year Change at constant FX Organic growth Growth from acquisitions
Revenue 2,495 2,419 3.2% 6.1% 2.9% 3.2%
Comparable growth (%) 1.7% 4.7%
Adjusted EBITDA 411 400 2.8% 4.3% 3.6% 0.7%
Adjusted EBITDA margin (%) 16.5% 16.5% -6bps
Number of stores (#) 6,454 5,922
System wide sales 2,747 2,672 2.8%
in millions of EUR (unless stated otherwise) 3Q16 3Q15
Change versus prior year Change at constant FX Organic growth
Growth from acquisitions
Revenue 825 808 2.2% 4.9% 1.6% 3.4%
Comparable growth (%) 0.4% 3.7%
Adjusted EBITDA 139 142 -1.9% 0.2% -0.2% 0.4%
Adjusted EBITDA margin (%) 16.8% 17.5% -69bps
System wide sales 908 889 2.1%
Group financial review
Revenue
Revenue grew by 3.2% to €2,495 million in 9M16 (€2,419 million in 9M15) or 6.1% at constant exchange rates. Organic revenue growth of 2.9% was driven by comparable growth of 1.7% (4.7% in 9M15).
Acquisitions had an impact on revenue of 3.2%, and currency translation effects were -3.0% primarily caused by the devaluation of the British Pound and certain emerging market currencies.
In 3Q16, revenue increased by 2.2% to €825 million, or 4.9% at constant exchange rates. Organic growth during 3Q16 was 1.6%. The comparable growth rate slowed down to 0.4% due to the weakness in the Other Europe segment, particularly in Finland and Italy as well as lower growth levels in the G4 and Americas & Asia segments.
Adjusted EBITDA
Adjusted EBITDA (i.e. EBITDA before non-recurring items) increased by 2.8% to €411 million in 9M16 (€400 million in 9M15) or 4.3% at constant exchange rates with organic adjusted EBITDA growth of 3.6% and a 0.7% contribution from acquisitions. The adjusted EBITDA margin remained constant at 16.5%.
Non-recurring items of -€6 million in 9M16 were mainly related to acquisition costs for recently acquired businesses and integration costs following the merger of the Italian business as well as one-off adjustments of inventory and insurance income.
In 3Q16, adjusted EBITDA decreased by 1.9% but increased by 0.2% at constant exchange rates to €139 million. The adjusted EBITDA margin decreased by 69 bps to 16.8% (17.5% in 3Q15). The decrease in EBITDA is mainly related to the lower level of comparable growth during the quarter.
A reconciliation from adjusted EBITDA to operating result for 9M16 is presented in the table below:
in millions of EUR 9M16 9M15
Adjusted EBITDA 411 400
Non-recurring items - 6 - 5
EBITDA 406 396
Depreciation and amortization of software - 94 - 89
EBITA 312 307
Amortization and impairments - 23 - 21
Operating result 289 285
Financial Position
Capital expenditure not related to acquisitions was €41 million in 3Q16 and €104 million in 9M16, compared to €34 million in 3Q15 and €98 million in 9M15. The increase is in line with the growth of the business. The majority of the capex was invested in store openings, maintenance and refurbishments.
Net debt decreased to €841 million from €911 million at the end of June 2016. The 12-month rolling net debt/EBITDA ratio decreased to 1.6x from 1.7x at the end of June 2016.
read more on
http://hugin.info/167729/R/2051840/767766.pdf
tijd 09.59
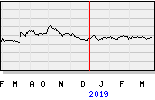
Grand Vision EUR 21,65 -2,42 vol. 432.000